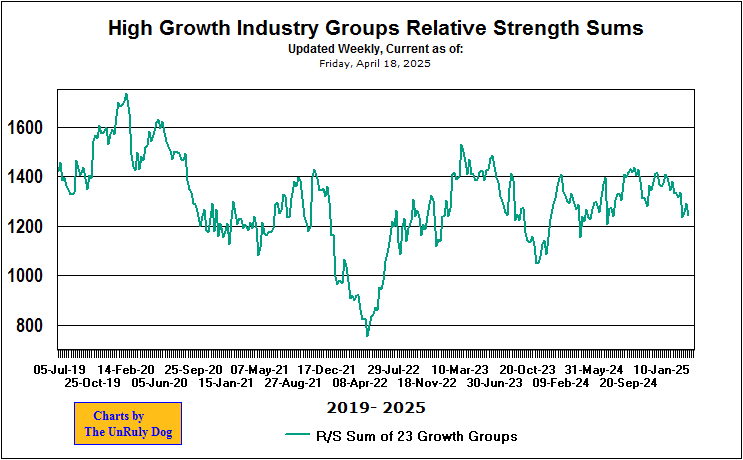
The HGS Summary Chart is a high growth stock industry group indicator used to determine longer term trends and rotation in and out of typical high growth industry groups.
It is constructed by summing the Relative Strength values of 24 high growth and cyclical growth industry groups that have been tracked since 1994. Twenty groups were originally tracked, but adjustments have been made as industry group composition has changed over time. The chart is updated once per week using closing data for the last trading day of the week, usually Friday.
It usually has little predictive value, aside from confirming the proximity of the market to support and resistance levels, but often provides validation of a market turn. It is also useful in determining whether or not typical growth groups are driving any recent market run up, or confirming if a market run is being lead by other, non high growth, sectors.

