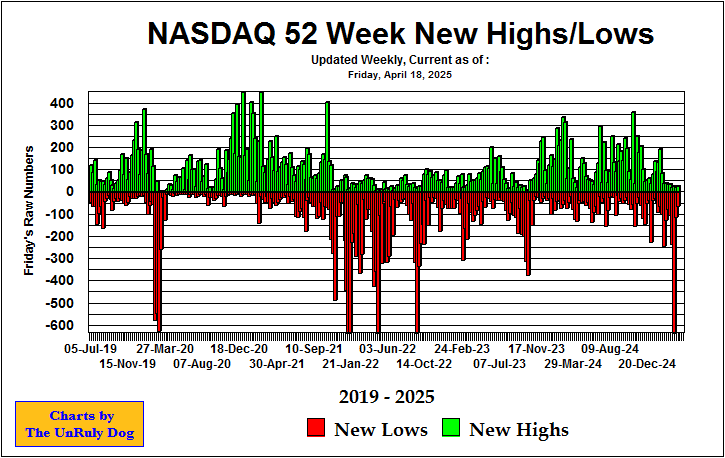
The NASDAQ 52 Week Highs & Lows is a plot of number of NASDAQ stocks that have made a new 52 week high or low on the last trading day of each week, usually Friday. The chart is updated weekly, usually on Saturday.
Strong markets or confirmation of market breakouts are usually signaled when the number of highs exceeds 150 and the number of new lows is less than 55.
Market bottoms are usually indicated with new high readings below 60 at the same time new low readings are in excess of 175.
Market rotation can be signaled when both highs and lows exceed 80 at the same time. This indicates that a large number of investors and institutions are leaving some previously favored industry groups and putting their money to work in newly emerging industry groups.
webmaster@unrulydog.com

