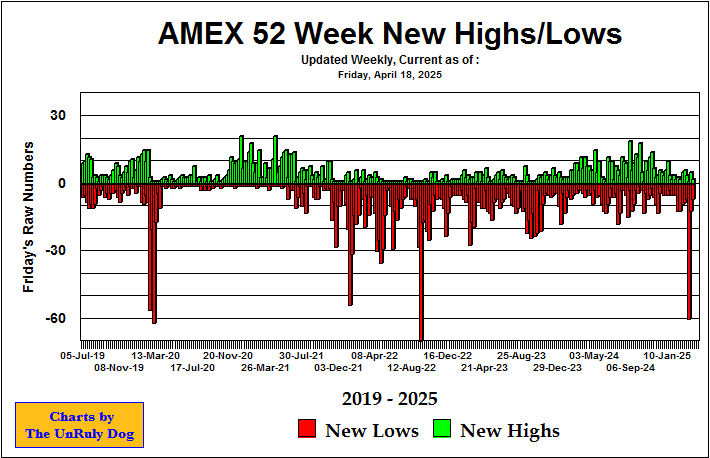
The American Stock Exchange 52 Week Highs & Lows is a plot of number of AMEX stocks that have made a new 52 week high or low on the last trading day of each week, usually Friday.
The chart is updated weekly, usually on Saturday.
Market bottoms are usually indicated with new high readings below 10, and new low readings in excess of 30.
Market rotation is usually signaled when both highs and lows exceed 20 at the same time, but is less reliable due to the smaller number of stocks that make up the index.

