
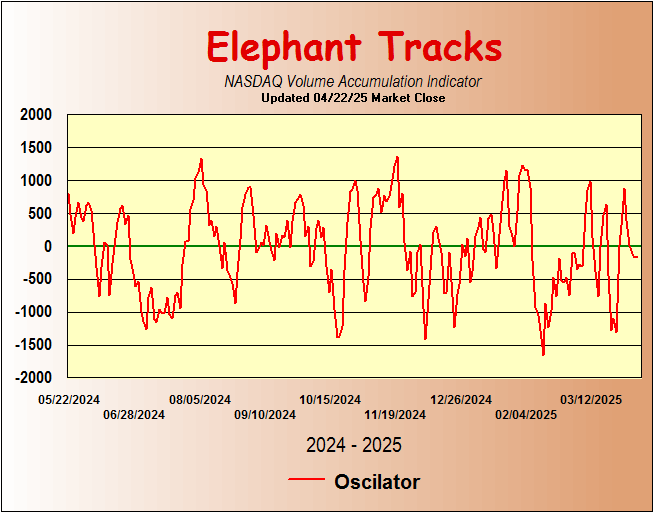
The NASDAQ Elephant Tracks Chart is a index indicator used to determine volume accumulation charted over the same time frame as the Lead Dog Indicator, and to confirm the direction and possible reversals of the index. It is constructed by looking at the relationship between volume, and the high, low and closing prices of the NASDAQ on a daily basis. The chart is updated daily. It usually has little predictive value, aside from confirming the proximity of the market to support and resistance levels, but often provides validation of a market turn. The indicator usually tracks in a range of plus or minus 200, and movement beyond those limits usually can be viewed as an overbought/oversold indication of the market. A move away from one extreme does not necessarily mean a move to the opposite extreme, as can be seen by the indicator’s performance in the March through April 2000 time frame. |
|
|