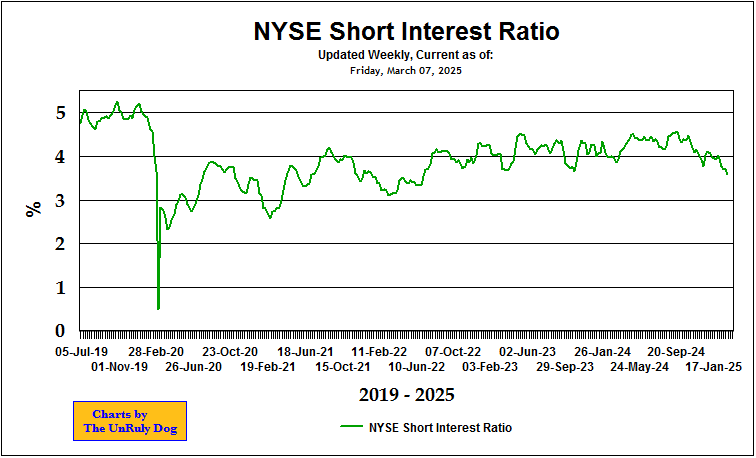
The NYSE Short Interest Ratio is used to determine the trend of the demand for stocks. It is constructed by dividing the average NYSE number of shares short over the past 30 days and dividing it by the average NYSE volume over the past thirty days. The chart is updated once per week using closing data for the last trading day of the week, usually Friday.
An increasing trend usually forecasts a move up in the market as any market strength causes the shorts to cover and drive up prices. A decreasing trend shows a decreased belief by investors that the market will head down, and indicates a reduced probability of an upward surge due short covering.

