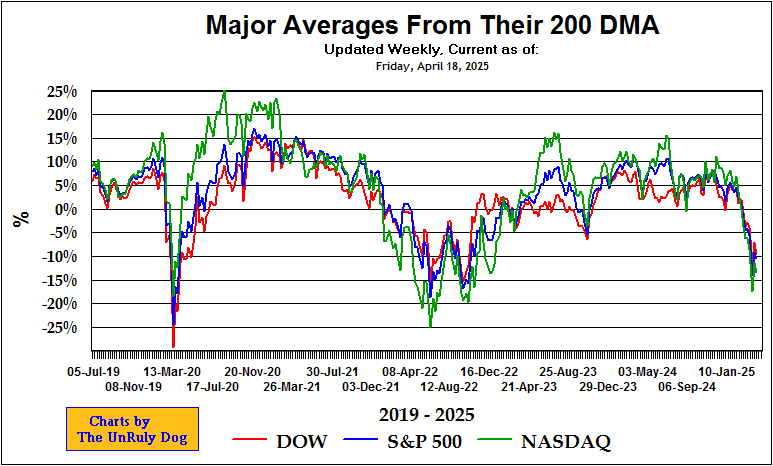
The Major Averages in Relation to their 200 day moving average (DMA) is useful in determining sector divergences, maturity of the current move, proximity to typical reversal points, and confirmation of slowing or reversing market momentum.
It is made up of the Dow Jones Industrial Average, the Standard and Poor’s 500, and the 85 Index. The chart plots the percentage each is from it’s respective 200 day moving average, and is updated once per week using closing data for the last trading day of the week, usually Friday.
Usually, after all three averages reach a point 13-15% above their respective moving average, there is a correction.
The chart is also useful is showing which sector is leading the current move up or down, or if all three indexes are moving in unison, or if only one sector is establishing a new direction.
Data since 1994 seems to indicate that prior to major corrections, the Dow peaks, then retreats slightly, then the 85 Index peaks and retreats, then the correction begins.
The extreme divergences of these indicators at times over the past year, has been the exception rather than the rule, looking at data going back to 1994.
When the markets are moving in unison, use of a simple trend line can help confirm market tops and bottoms.

