
 |
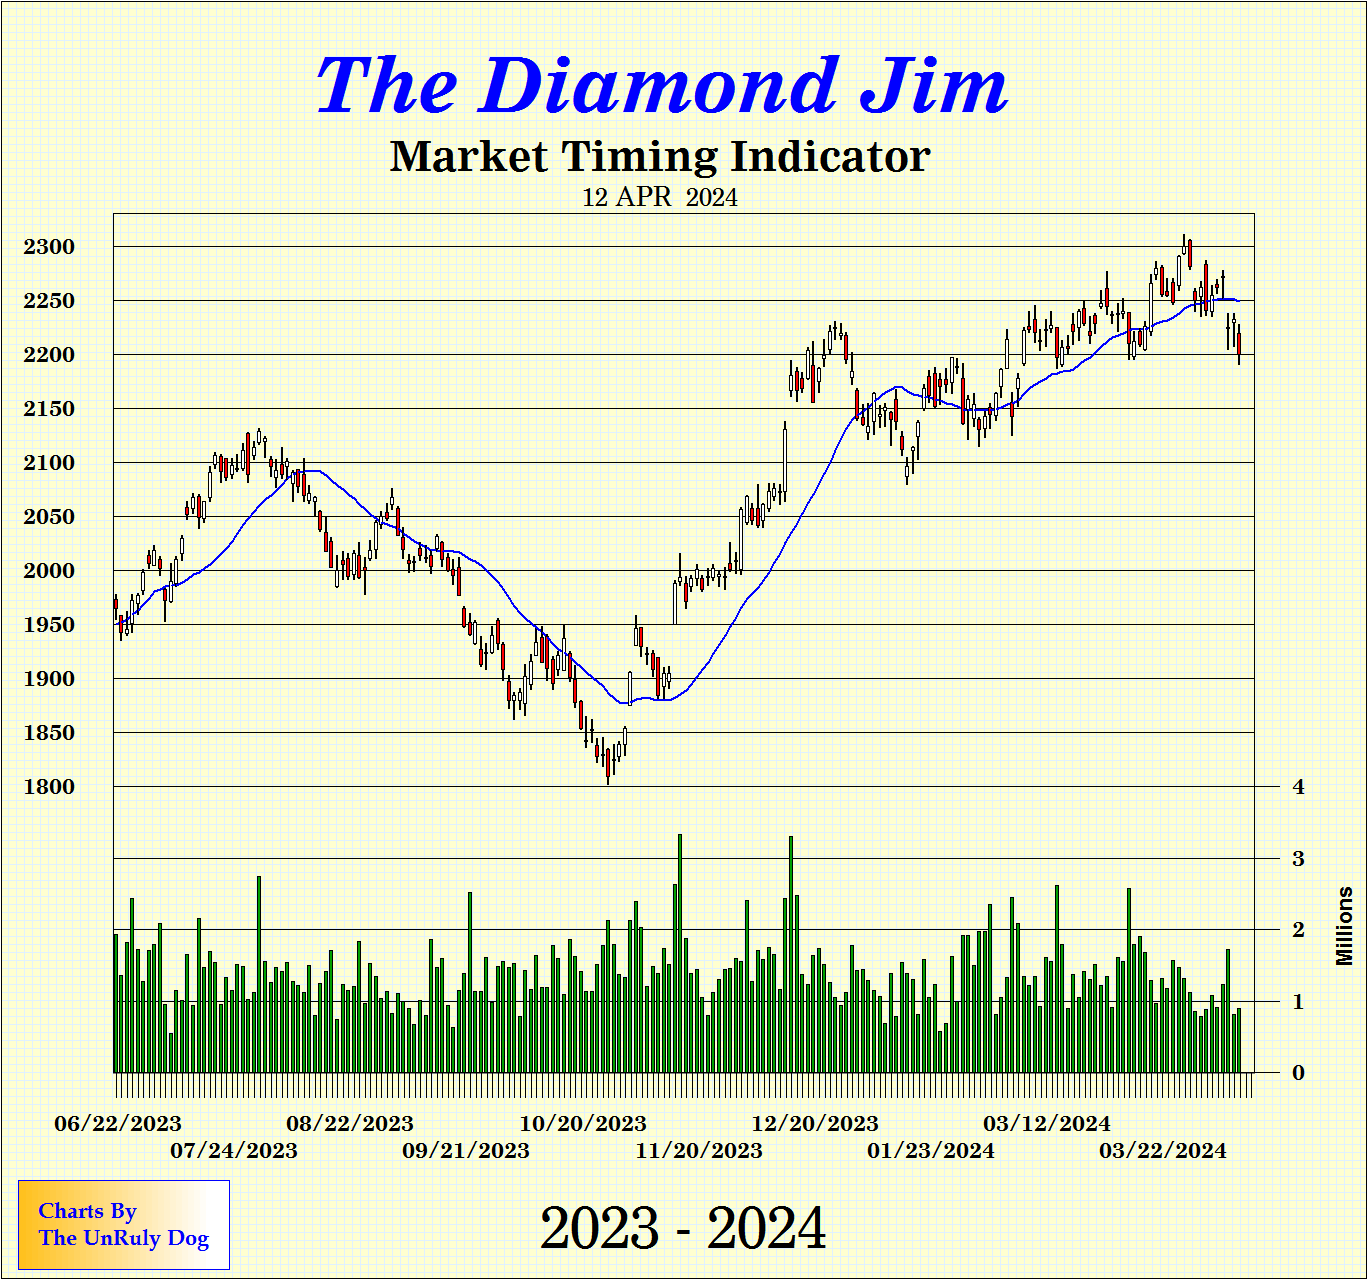
The above chart of the Diamond Jim Market Timing Indicator is named after the famed Diamond Jim Brady, from the era of Jesse L. Livermore. It was designed for the “black and white” trader, the individual that only wants to look at one chart to help them decide “should I be in or out of the market.”It is read simply by determining which side of the blue line the current candle has closed on. Below the line, you should be in cash or short. Above the line, you should be in the market.Transition confirmation is provided by two sequential closes on the opposite side of the blue line, the most recent farther away from the line than the first. Recent examples demonstrate how well this works. As with all indicators, it will not work 100% of the time, but provides decisive conformation when working with other indicators like “The Lead Dog”.On April 7, 2005, it appeared we would cross to the buy side, but the next day, Friday, the indicator experienced a large down day and remained bearish. Likewise, on February 18th the indicator penetrated the line with a very bearish candle, but rose over the next two trading days, eventually crossing back above the line, and never providing the second lower down day to confirm the bearish turn. The market down turn during the first few days of 2005 were clearly confirmed, as was the subsequent market turn up at the end of January.
| 1856 – 1917  Born in New York City (James Buchanan Brady), Diamond Jim was a philanthropist and financier. He made his fortune in railroad supplies, but also traded stocks and cotton. Known for his large appetite, large diamond collection and a large donation in 1912 that founded the James Buchanan Brady Urological Institute at Johns Hopkins Hospital in Baltimore, Maryland.By an odd coincidence, the Diamond Jim Market Timing Indictor was developed by a member of the Society of Market Technicians, from an undisclosed location, not far from Baltimore. Born in New York City (James Buchanan Brady), Diamond Jim was a philanthropist and financier. He made his fortune in railroad supplies, but also traded stocks and cotton. Known for his large appetite, large diamond collection and a large donation in 1912 that founded the James Buchanan Brady Urological Institute at Johns Hopkins Hospital in Baltimore, Maryland.By an odd coincidence, the Diamond Jim Market Timing Indictor was developed by a member of the Society of Market Technicians, from an undisclosed location, not far from Baltimore. |