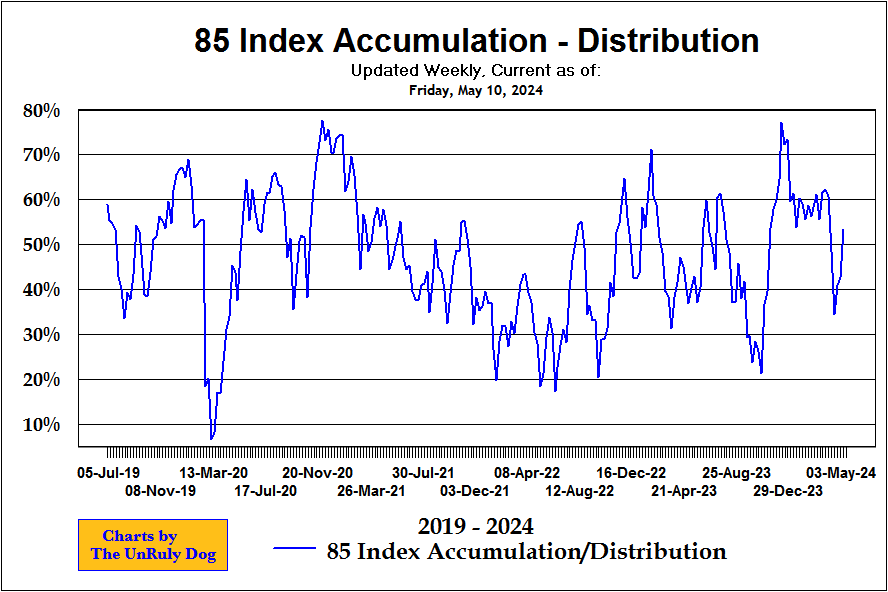
The 85 Index Accumulation Distribution Indicator is based on the changes of price and volume of the stocks within the index within the last 90 days. It is a measure of the stocks under accumulation as a percentage of the whole index and attempts to identify the strength of current institutional buying and selling.
The chart is updated once per week using closing data for the last trading day of the week, usually Friday. Near market tops the indicator will range from 72-85%. During sound bull markets, the indicator will drift between 62 and 71%. During bear markets or significant corrections, the indicator will bottom below 45%. After making a recent bottom, there is a high percentage chance that the market will continue to move up once the indicator exceeds 53%.
