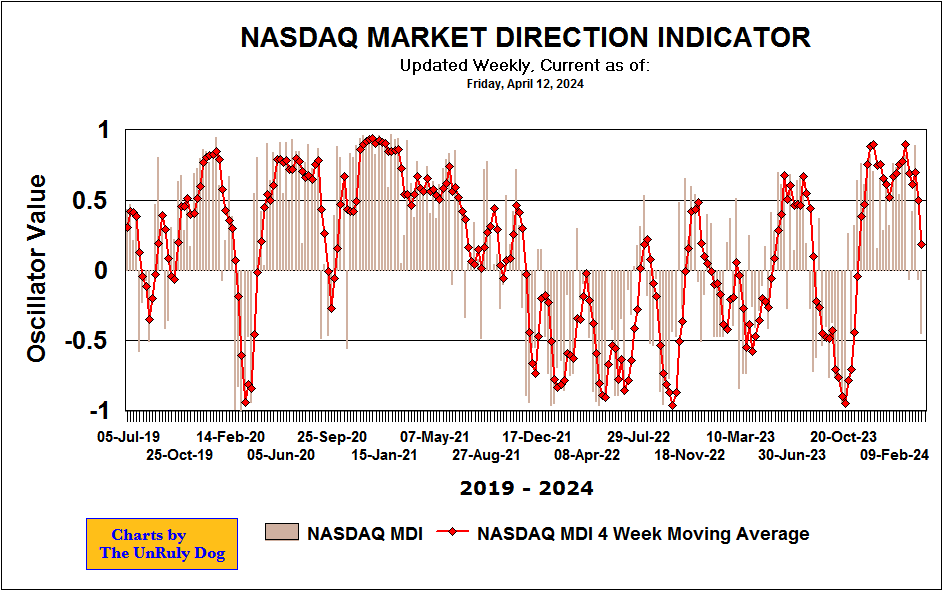
The NASDAQ Market Direction Indicator is used to determine the maturity of the current trend, probable direction, and proximity to extremes and turning points. It is an oscillator, ranging from +1 to -1. The formula for the MDI is as follows:
Where H is equal to the number of stocks making new 52 week highs, and L is equal to the number of stocks making new 52 week lows. The chart is updated once per week using closing data for the last trading day of the week, usually Friday.
Extreme readings indicate strongly trending markets, while readings near zero occur in non trending markets or times of significant sector rotation when both high and low numbers tend to be near extreme high readings.

