
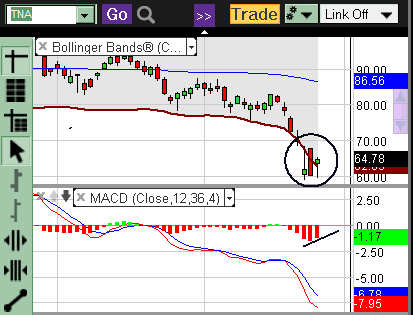
We are starting to see the signs of a short term bottom. From the below daily chart of TNA that the downward momentum of the MACD has turned up, as can be seen by the black trend line. For those trading with with the Roberson System, we have a valid alert on the daily chart in that the price action has pierced the bottom Bollinger Band and the Stochastic reading reached a level below 25. We just need the buy signal to follow, which will be when the MACD signals the cross.
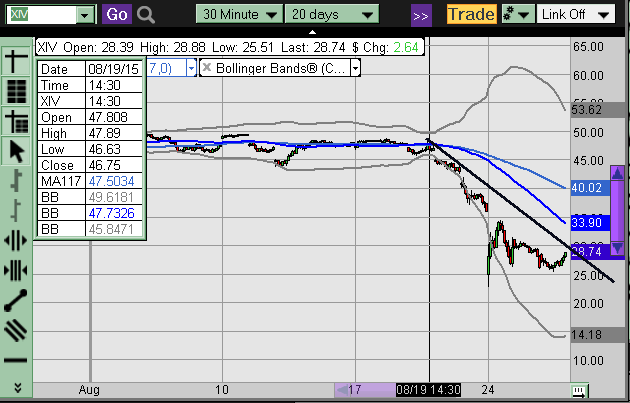
Market wise, looking at the XIV 30 minute chart and my “30/117 line in the sand” indicator, we can see that XIV is now trading in a range between 25 & 33.50. We can also see that the short term down trend is close to being broken (black trend line), while the 117 line (bright blue) is quickly approaching the price action. It then needs to turn up, which also means we should be seeing price action above the 117 line.
Lastly, for short term traders (TNA 3 minute chart) that are using the Roberson system, we got a valid alert after the Bollinger Band center line turned up (blue) and then was touched by the price action coincident with the stochastic reading below 25. We then got the MACD buy signal, making this a three point trade if held until just before today’s close.
